I lean on Claude and ChatGPT throughout the day. Coding, homelab troubleshooting, almost everything on this blog goes through one of them. So when a response comes back garbled, cuts off mid-sentence, or an agent stops responding, my first instinct used to be to blame myself. Maybe my prompt was bad. Maybe my network was flaky. More often than I would like to admit, it was neither. It was a provider-side outage or a degraded performance window. I only found that out after several minutes of retrying and second-guessing myself.
Both Anthropic and OpenAI run public status pages, backed by a standard Statuspage.io API. So the fix was straightforward. Pull that status into Home Assistant, and put a badge on my dashboard. Now, if an agent is behaving strangely, I glance at the badge first.
Two REST sensors, one purpose
Both sensors follow the same shape. A REST resource points at the provider’s summary.json endpoint, polled every 60 seconds. A value_template turns the raw API response into a short, human-readable status string. The goal is not a full incident dashboard – I already have the status pages for that. The goal is a single badge that answers one question at a glance: is the AI provider I am about to lean on actually healthy right now?
ChatGPT’s status API exposes a clean, top-level status.indicator field. That made the sensor simple from the start. Map none, minor, major, critical and maintenance to friendly labels, and you are done.
Claude’s API works a bit differently. Instead of one top-level indicator, it lists every individual component – claude.ai, the API, the Console, and so on – each with its own status string. My first version picked out the claude.ai component and passed its status straight through. That worked, but it produced raw Statuspage values like degraded_performance, instead of the clean wording the ChatGPT badge shows. The fix was quick: map those component statuses through the same friendly-name dictionary already used on the ChatGPT sensor. Both badges now speak one consistent vocabulary, no matter which provider is having a bad day.
The configuration
Both sensors live under the same platform: rest entry in configuration.yaml. They poll once a minute, with a 15 second timeout, so a slow status page does not hold up other REST sensors on the same update cycle.
- resource: "https://status.claude.com/api/v2/summary.json"
  method: GET
  scan_interval: 60
  timeout: 15
  headers:
    Accept: "application/json"
    User-Agent: "Home Assistant"
  sensor:
    - name: "Claude Platform Status"
      unique_id: claude_platform_status
      icon: mdi:robot-outline
      availability: >
        {{ value_json is defined
           and value_json.components is defined }}
      value_template: >
        {% set status_names = {
          'operational': 'Operational',
          'degraded_performance': 'Minor outage',
          'partial_outage': 'Partial outage',
          'major_outage': 'Major outage',
          'under_maintenance': 'Under maintenance'
        } %}
        {% set component = value_json.components
           | selectattr('name', 'equalto', 'claude.ai')
           | list
           | first %}
        {% if component is defined %}
          {{ status_names.get(component.status, component.status) }}
        {% else %}
          unknown
        {% endif %}

- resource: "https://status.openai.com/api/v2/summary.json"
  method: GET
  scan_interval: 60
  timeout: 15
  headers:
    Accept: "application/json"
    User-Agent: "Home Assistant"
  sensor:
    - name: "ChatGPT Platform Status"
      unique_id: chatgpt_platform_status
      icon: mdi:chat-processing-outline
      availability: >
        {{ value_json is defined
           and value_json.status is defined
           and value_json.status.indicator is defined }}
      value_template: >
        {% set status_names = {
          'none': 'Operational',
          'minor': 'Minor outage',
          'major': 'Major outage',
          'critical': 'Critical outage',
          'maintenance': 'Under maintenance'
        } %}
        {{ status_names.get(
          value_json.status.indicator,
          value_json.status.indicator
        ) }}
      json_attributes_path: "$.status"
      json_attributes:
        - description
        - indicator
On the dashboard
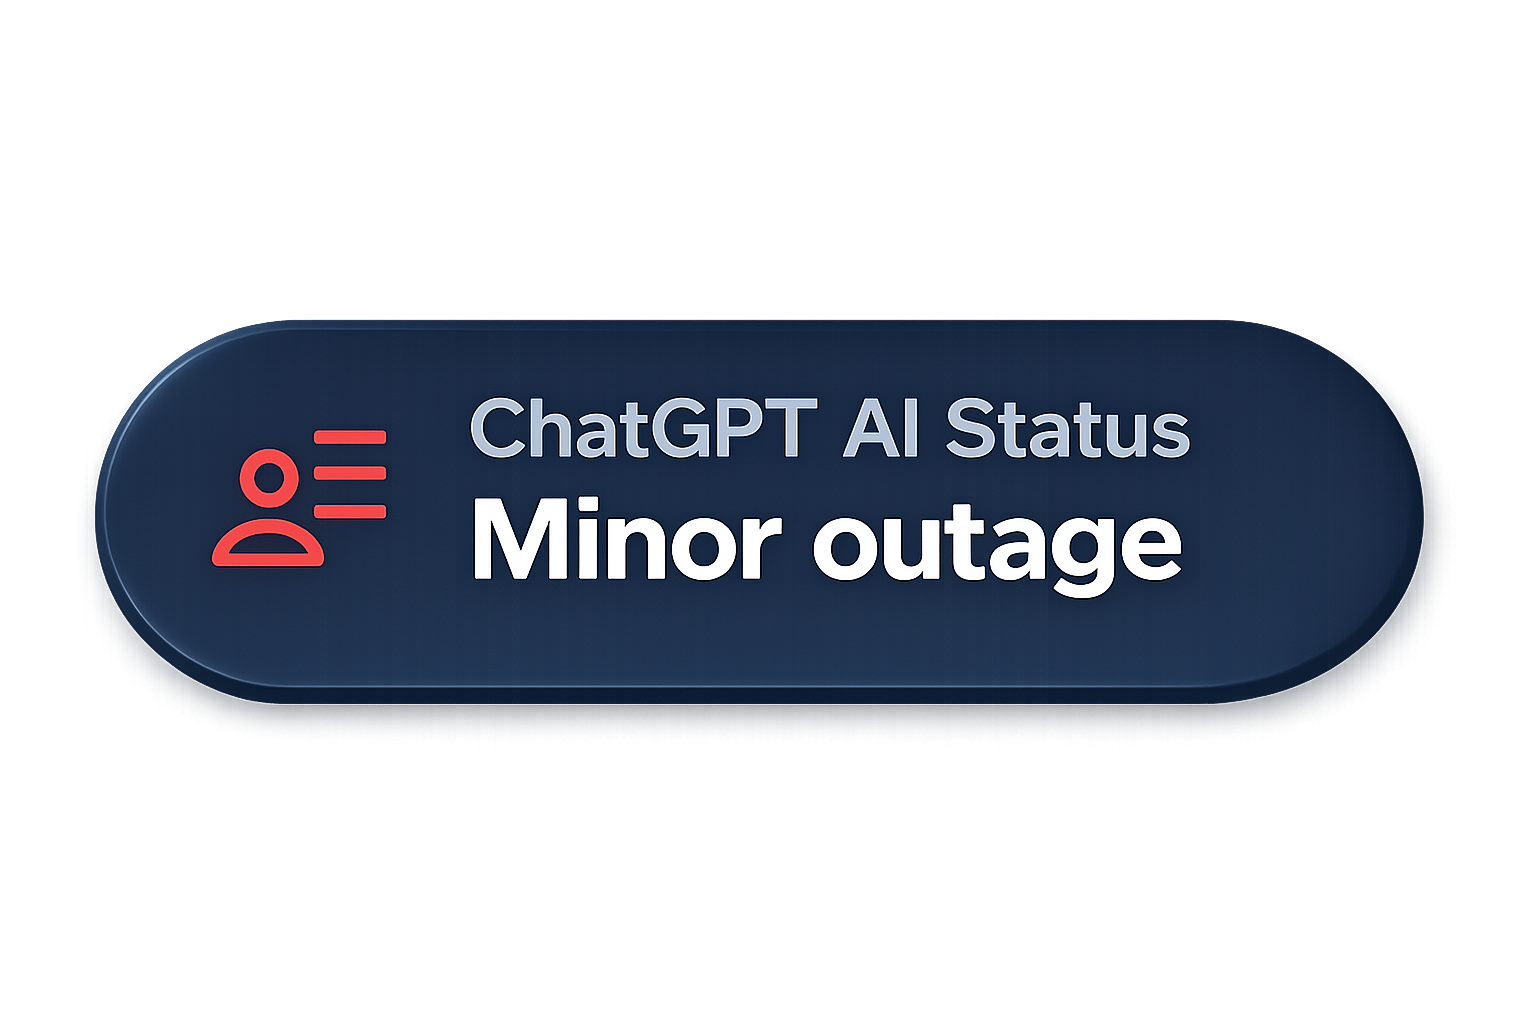
Both sensors sit as small badge-style entities near the top of my main dashboard. They show green for operational, and shift to amber or red the moment either provider reports anything else. It is a tiny addition compared to some of the other automations on this blog. But it has already saved me a few minutes of pointless troubleshooting more than once – the badge flips to “Minor outage,” and I know immediately the problem is not mine.
type: entity
show_name: true
show_state: true
show_icon: true
entity: sensor.chatgpt_platform_status
color: red
icon: mdi:account-details-outline
name: ChatGPT AI Status
tap_action:
  action: url
  url_path: https://status.openai.com/
show_entity_picture: false
state_content: state
visibility:
  - condition: state
    entity: sensor.chatgpt_platform_status
    state_not: Operational