
Home Assistant 2026.5 shipped a genuinely useful new feature: a built-in Maintenance dashboard. It automatically discovers every battery entity in your setup, groups everything neatly by area, and gives you a bird’s eye view of your entire battery inventory. The HA team calls it one of the most-requested views ever — it looks great and requires zero configuration.
I don’t use it for actual battery monitoring, and I want to explain why.
What the Maintenance Dashboard Actually Shows You
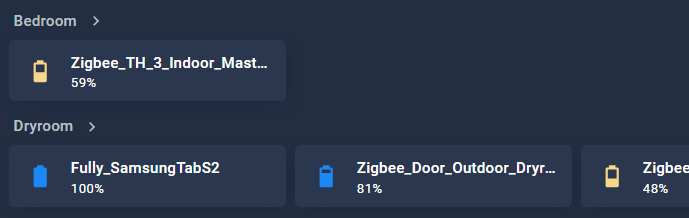
The Maintenance dashboard pulls in every device that exposes a battery sensor — and in a well-equipped smart home, that list gets long fast. Motion sensors, door contacts, buttons, remotes, smoke detectors, presence tags, thermostatic radiator valves, tablets running the Companion app, even some UPS units. Everything lands on that dashboard, grouped per area, with a percentage tile for each.
The community noticed something almost immediately after launch: the warning colour kicks in below 60%, which means many devices that comfortably live in the 40–55% range for most of their battery life are permanently displayed in amber — even though they don’t need any attention whatsoever.
That’s the core issue. A dashboard that is always orange is a dashboard you stop reading.
The Signal-to-Noise Problem
I run roughly 2,900 entities in my Home Assistant setup, and a meaningful chunk of those are battery-powered. If I open the Maintenance dashboard, I’m looking at dozens of devices at various charge levels, most of which are perfectly fine and don’t require any action from me today, tomorrow, or this month.
This is dashboard noise. When everything is visible, nothing is actionable.
The purpose of a monitoring dashboard isn’t to display data — it’s to surface the things that need your attention right now. A motion sensor at 72% doesn’t need my attention. A door contact at 18% absolutely does. Showing them side by side, in the same view, with similar visual weight, trains your brain to start ignoring the dashboard entirely. You’ve seen it before, nothing catastrophic was happening, so you’ll check it again later. That’s how dead batteries sneak up on you.
A Two-Layer Approach
My setup uses two pieces that work together: a template sensor for alerting, and a Markdown card for display. They’re not redundant — they each do something the other can’t.
Layer 1: The Template Sensor
The template sensor lives in HA’s state machine as a persistent entity. It counts devices that have dropped at or below 20% and exposes that count as its state. It also builds a list of the actual device names as an attribute — not entity IDs, not sensor names, but human-readable device names, falling back gracefully through name_by_user, name, and finally the sensor name if nothing else is available.
Because it’s a real entity, it can do things a dashboard card never could: trigger automations, appear as a badge in the HA header, be used in conditions, and get tracked in history. When the count is zero, nothing in the UI draws your attention. The moment it goes above zero, the badge lights up. That’s the alerting layer.
- name: "Low Battery Devices"
  unique_id: count_low_batt_devices
  state: "{{ this.attributes.get('devices', []) | count }}"
  icon: >
    {% set count = this.attributes.get('devices', []) | count %}
    {{ 'mdi:numeric-9-plus-circle' if count > 9 else ('mdi:numeric-' ~ count ~ '-circle') }}
  attributes:
    devices: >
      {% set threshold = 20 %}
      {% set batt_sensors = states.sensor
          | selectattr('attributes.device_class', 'defined')
          | selectattr('attributes.device_class', 'eq', 'battery') | list %}
      {% set ns = namespace(batt_low=[]) %}
      {% for s in batt_sensors if s.state | float(101) <= threshold %}
        {% set ns.batt_low = ns.batt_low + [device_attr(s.entity_id, 'name_by_user')
                                            or device_attr(s.entity_id, 'name')
                                            or s.name] %}
      {% endfor %}
      {{ ns.batt_low }}
Layer 2: The Markdown Card
The Markdown card is the display layer. It only runs when the dashboard is open, but what it renders is significantly richer than anything the template sensor exposes. It sorts devices by battery level so the most critical appear first, shows the actual percentage next to each device name, and handles two sensor types the template sensor doesn’t cover:
- Binary battery sensors — some devices (certain Matter/Thread hardware, for example) don’t expose a percentage at all. They expose a
binary_sensorwithdevice_class: batterywhereonmeans low. The Markdown card catches these and lists them separately with an orange indicator. - Entity exclusions — a
rejectattrfilter strips out unwanted matches by friendly name, keeping the list clean from false positives like energy monitoring devices that happen to report a battery-class sensor.
When no devices are below threshold, the card simply shows a green checkmark. No empty list, no noise — just a clear all-clear.
{% set threshold = 25 %}
{% set batt_sensors = states.sensor
    | selectattr('attributes.device_class', 'defined')
    | selectattr('attributes.device_class', 'eq', 'battery')
    | rejectattr('attributes.friendly_name','search','Energy Site')
    | list
%}
{% set batt_binary = states.binary_sensor
    | selectattr('attributes.device_class', 'defined')
    | selectattr('attributes.device_class', 'eq', 'battery')
    | list
%}
{% set ns = namespace(items=[], low_binary=[]) %}
{% for s in batt_sensors %}
  {% set val = s.state | float(101) %}
  {% if val <= threshold %}
    {% set name = device_attr(s.entity_id, 'name_by_user') or device_attr(s.entity_id, 'name') or s.name %}
    {% set unit = s.attributes.unit_of_measurement or '%' %}
    {% set ns.items = ns.items + [{'name': name, 'value': val, 'unit': unit}] %}
  {% endif %}
{% endfor %}
{% for s in batt_binary %}
  {% if s.state == 'on' %}
    {% set name = device_attr(s.entity_id, 'name_by_user') or device_attr(s.entity_id, 'name') or s.name %}
    {% set ns.low_binary = ns.low_binary + [name] %}
  {% endif %}
{% endfor %}
{% set items = ns.items | sort(attribute='value') %}
{% if items | length == 0 and ns.low_binary | length == 0 %}
✅ No batteries under {{ threshold }}%.
{% else %}
{% if items | length > 0 %}
**{{ items | length }} device{{ '' if items | length == 1 else 's' }} under {{ threshold }}%:**
{% for i in items %}
🔴 **{{ i.name }}** — {{ i.value | round(0) }}{{ i.unit }}
{% endfor %}
{% endif %}
{% if ns.low_binary | length > 0 %}
**{{ ns.low_binary | length }} device{{ '' if ns.low_binary | length == 1 else 's' }} reporting low battery:**
{% for name in ns.low_binary %}
🟠 **{{ name }}** — Low
{% endfor %}
{% endif %}
{% endif %}

How the Two Layers Work Together
The template sensor handles the when: it watches continuously, maintains state, and fires the badge when something needs attention. The Markdown card handles the what: when you open the dashboard because the badge told you to, it gives you a sorted, readable list of exactly which devices to deal with and how urgent each one is.
Neither replaces the other. You could use the template sensor alone and check its devices attribute in the developer tools — but that’s clunky. You could use the Markdown card alone — but then you’re relying on yourself to remember to open the dashboard. Together, the sensor tells you something is wrong and the card tells you what.
The Bigger Principle
I think about this in terms of cognitive load. Every item you put on a dashboard that doesn’t require action is a tax on your attention. Over time, you pay that tax by training yourself to skim past it — and then you also start skimming past the things that do matter.
A good home automation dashboard isn’t a status board showing you everything that exists in your home. It’s a decision-support tool that tells you what to do next. For battery monitoring, the only question worth asking is: which devices need new batteries right now? Everything else is noise.
The Maintenance dashboard is a great inventory view, and I wouldn’t discourage anyone from exploring it. But for day-to-day home automation, I want a system that is silent when everything is fine — and precise when it isn’t. A persistent sensor for alerting, a Markdown card for the details. That combination does exactly what the Maintenance dashboard doesn’t: it only bothers you when something actually needs your attention.


