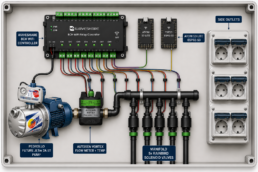
After weeks of plumbing, wiring and digging, my garden irrigation system finally does what it was built for: it waters the garden. But hardware alone doesn’t make it smart. What turns a box of valves, a pump and a relay board into something my whole family can actually use is the Home Assistant dashboard sitting on top of it.
I wanted one place where I can see at a glance whether the controller is online, whether the pump is running and how much water has gone into the garden today, and where I can start any zone with two taps. I also wanted to see what is happening underground, so the soil sensors got a spot on the same view.
In this post I’ll walk through my Home Assistant irrigation dashboard section by section: what each card shows, which entities drive it, and the package of scripts and automations behind the buttons that keeps the pump, the valves and the timers in sync.
The building blocks
Before looking at the cards, a quick recap of what the dashboard is talking to:
- Waveshare 8CH relay running ESPHome, switching the solenoid valves of the pump-fed zones R1 to R5.
- Pedrollo pump, powered through a Shelly Plug S Gen3, so Home Assistant can switch it and measure its power draw.
- Autosen flow and temperature meter, read by an M5Stack AtomS3 Lite with ESPHome.
- Two Sonoff Zigbee water valves on tap water for zones R7 (roses) and R8 (back lawn).
- A LilyGO T3 868 MHz receiver picking up two WH52 soil sensors in the borders.
On the frontend I use button-card for nearly everything, layout-card for the responsive grid, bubble-card for the settings pop-up, apexcharts-card for the soil history and card-mod for a few style tweaks. All of them are available through HACS.
The status bar
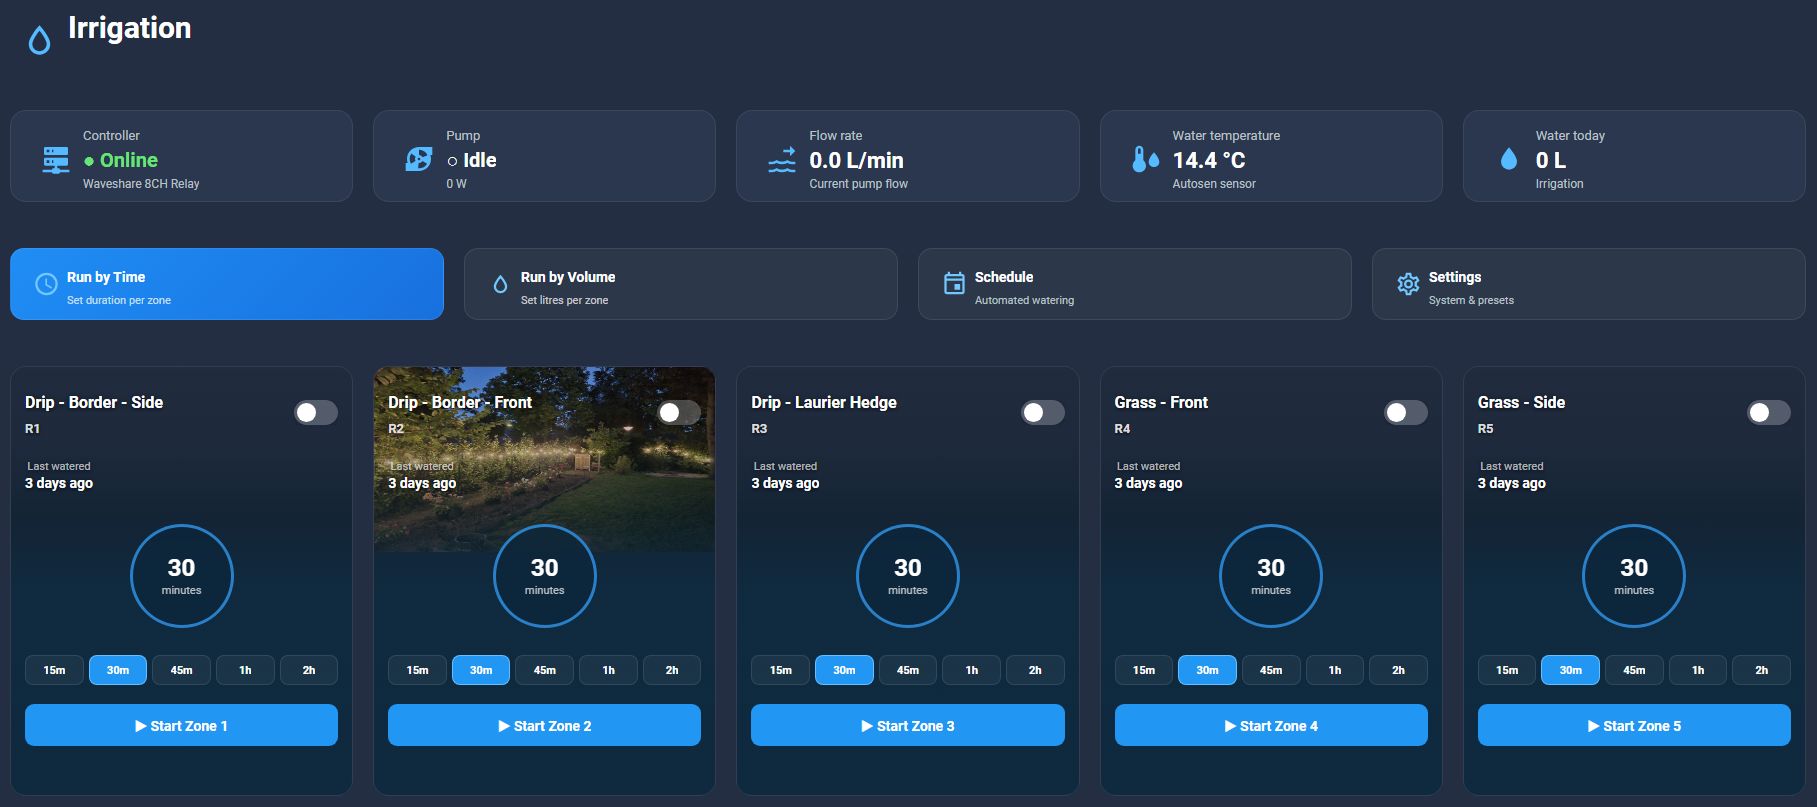
The top row consists of five small tiles that answer the questions I ask most often:
- Controller: the status binary sensor of the Waveshare relay board, shown as a green Online or a red Offline.
- Pump: based on the power reading of the Shelly plug. Above 10 W the pump is considered Running, otherwise Idle. Tapping the tile toggles the plug, which is handy when priming or testing.
- Flow rate: the live L/min reading from the Autosen meter.
- Water temperature: the temperature output of the same meter.
- Water today: the total amount of water pumped into the garden today.
The flow meter only reports litres per minute, so to get a total I integrate the flow over time with the integration (Riemann sum) platform, and then feed that total into two utility meters that reset daily and monthly. A small template sensor rounds the daily value for display.
sensor:
  - platform: integration
    source: sensor.esphome_m5stack_atoms3lite_autosen_waterflow_autosen_flow
    name: Irrigation Water Total
    unique_id: irrigation_water_total
    unit_time: min
    round: 0
    method: left

utility_meter:
  irrigation_water_daily:
    source: sensor.irrigation_water_total
    name: Irrigation Water Daily
    cycle: daily

  irrigation_water_monthly:
    source: sensor.irrigation_water_total
    name: Irrigation Water Monthly
    cycle: monthly
The unit_time: min is the important bit: because the source is in L/min, it makes the integrated total come out in litres.
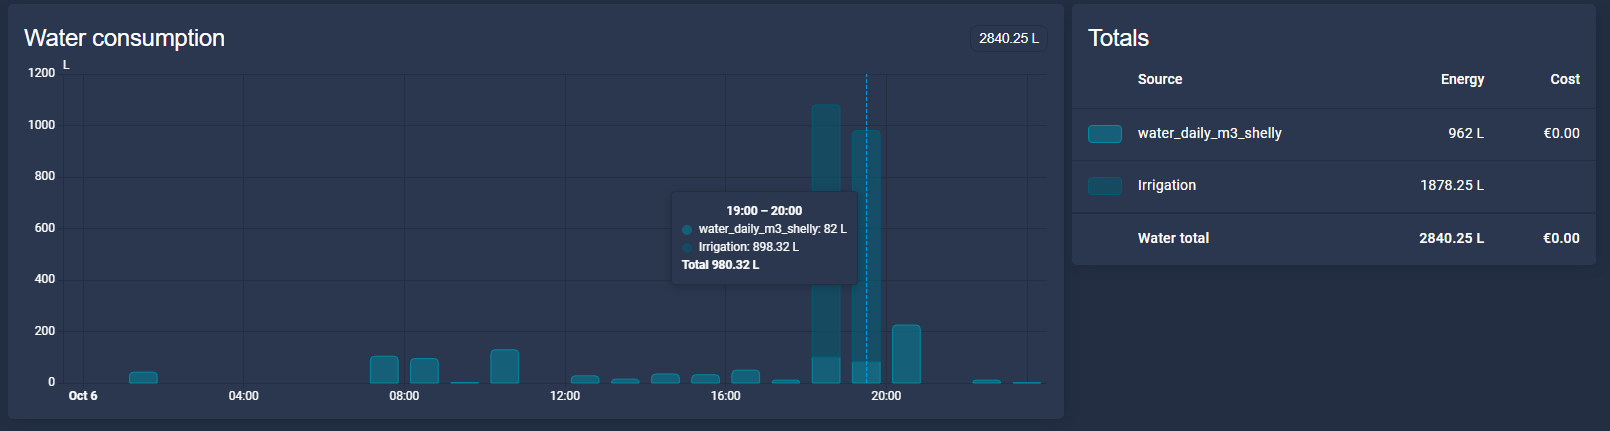
The utility meter can be added to the Energy Dashboard, so on the selected date, the irrigation usage can be seen (next to the household tap water):
Run by Time or Run by Volume
Below the status bar are four navigation tiles. The first two switch the run mode, stored in input_select.irrigation_run_mode. The active mode is highlighted in blue, and every zone card below immediately follows the selected mode.
- Run by Time: each zone runs for a set number of minutes, using its own timer helper. Multiple zones can run at the same time, which is useful for the drip zones.
- Run by Volume: each zone runs until a target number of litres has passed through the flow meter.
Volume mode works by remembering the meter value at the start of a run. Just before the valve opens, the start script stores the current total in input_number.irrigation_volume_start_meter, then waits until the difference reaches the target, or until someone presses Stop:
- wait_template: >
    {% set current = states('sensor.irrigation_water_total') | float(0) %}
    {% set started = states('input_number.irrigation_volume_start_meter') | float(0) %}
    {% set delivered = [current - started, 0] | max %}
    {{ delivered >= (volume_target | float(250))
       or not is_state(relay_entity, 'on') }}
  timeout: "04:00:00"
  continue_on_timeout: true
Because all pump-fed zones share a single meter, volume mode is strictly one zone at a time. A separate automation enforces this: when a relay turns on while in volume mode, all other relays are switched off and their timers cancelled. The four-hour timeout is a safety net in case the meter ever stops reporting.
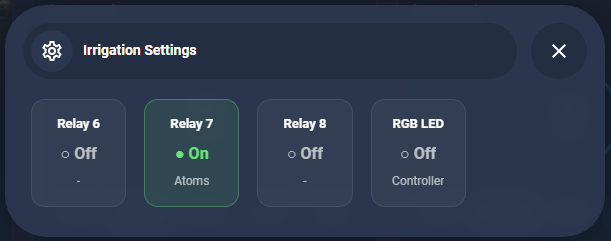
The other two tiles open the Schedule view and the Settings pop-up to switch relays if needed. (Relays 6 and 8 are not in use at this moment. Since the irrigation manifold has 6 outlets and only 5 are currently in use, relay 6 is a spare for this. Relay 8 is connected to a wall socket and can be used later to power cycle a future connected device).
The zone cards
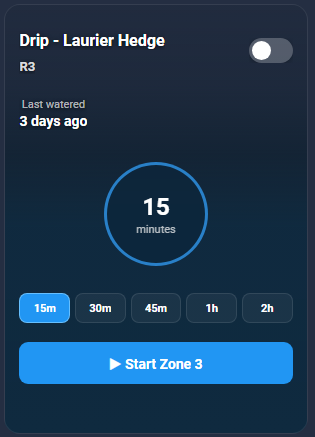
The heart of the dashboard is a row of zone cards, one per irrigation zone. Each card is a single button-card with nested button-cards for the presets and the start button, and it contains:
- A background photo of the zone that fades into the card colour through a gradient, so I immediately recognise which part of the garden I’m looking at.
- The zone name and relay number (R1, R2 and so on) with a toggle that mirrors the actual relay state.
- Last watered, shown in a human-friendly way: “Today 19:02”, “1 day ago” or “6 days ago”. The value comes from an
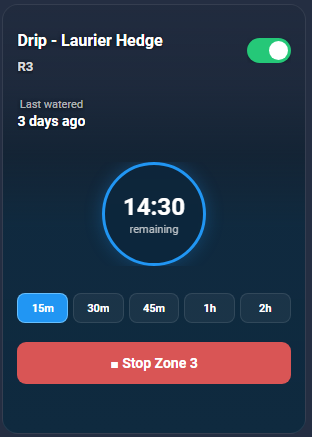
input_datetimeper zone that is updated whenever a run finishes or is stopped. - A target circle showing the configured minutes or litres. As soon as the zone starts, it turns into a live countdown (calculated from the timer’s
finishes_atattribute and refreshed every second viaupdate_timer: 1s) or, in volume mode, into the litres remaining. - Five presets that change with the run mode: 15m, 30m, 45m, 1h and 2h in time mode, and 50L, 100L, 250L, 500L and 1kL in volume mode. The active preset is highlighted.
- A Start Zone button that turns into a red Stop Zone button while the zone runs. It calls the start or stop script and passes the zone number.
How does it looks like when a zone is changed to Start?


Pump-fed zones and tap-water zones
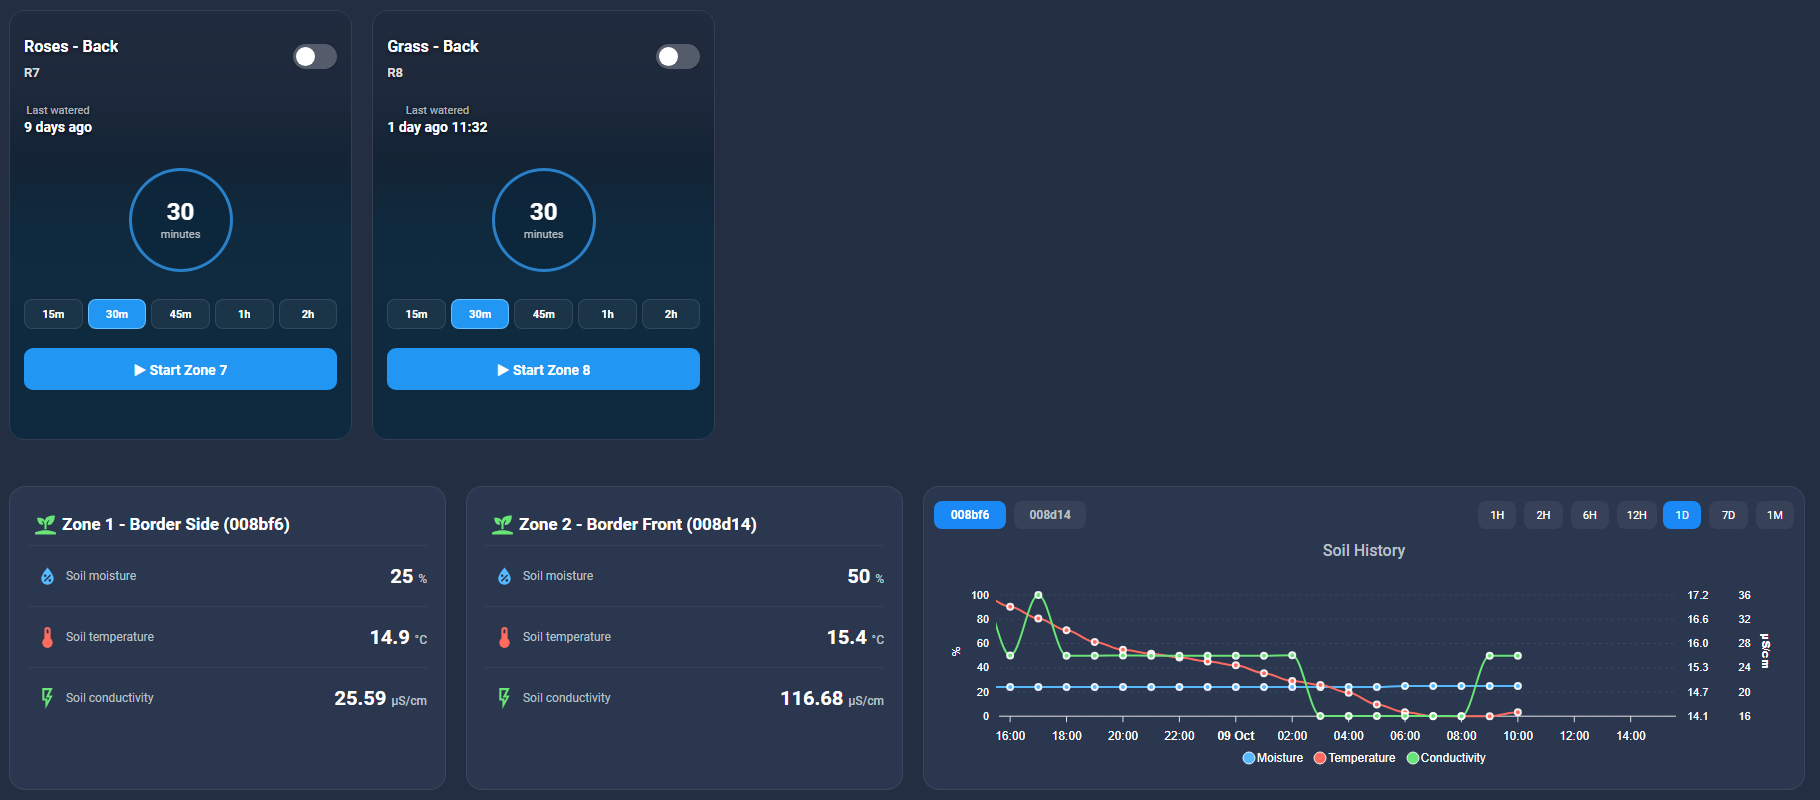
Not all zones are equal. Zones R1 to R5 (the drip lines for the borders and the laurel hedge, and the sprinklers for the front and side lawn) run on groundwater via the pump and the Waveshare relay board. Zones R7 and R8 (the roses and the back lawn) run on tap water through two Sonoff Zigbee valves. Why are these two using tap water? They are located far from the groundwater source (100m) and at this point I don’t see a financial reason to put a 100m pipe to this location. The expected amount of used tap water is also way less compared to the rest of the garden.
That difference matters for the logic. The tap-water zones have their own start and stop scripts, are always time-based, can run independently of each other and never touch the pump. On the dashboard they look exactly the same as the other zones, but their cards are hard-wired to time mode, so switching to Run by Volume doesn’t affect them.
The logic behind the buttons
All helpers, scripts and automations live in a single package file: /homeassistant/packages/irrigation.yaml. Keeping everything in one package makes it easy to back up, share and reason about. Don’t forget to include this file into your configuration.yaml file. The package file contains:
- Helpers: run mode, enable switches, minutes and litres per zone, a timer and a last-watered timestamp per zone.
- irrigation_start_zone: validates the zone, starts the pump if needed, opens the valve and starts either the timer or the volume wait.
- irrigation_stop_zone: cancels the timer, closes only that valve and records the last-watered time.
- irrigation_stop_all: cancels all timers, stops the pump, waits half a second for the pressure to drop and then closes all valves.
- Timer finished automations that close the right valve and record a successful run.
- A restart safety automation that stops everything when Home Assistant starts, so a restart in the middle of a run never leaves a valve open.
Because time mode allows several zones at once, the pump can’t simply be switched off when one zone finishes. That job belongs to a shared pump manager: whenever any relay changes, it checks whether at least one valve is still open and switches the pump accordingly.
- id: irrigation_shared_pump_manager
  alias: Irrigation - Shared Pump Manager
  mode: restart
  triggers:
    - trigger: state
      entity_id:
        - switch.waveshare_8ch_relay_irrigation_relay_1
        - switch.waveshare_8ch_relay_irrigation_relay_2
        - switch.waveshare_8ch_relay_irrigation_relay_3
        - switch.waveshare_8ch_relay_irrigation_relay_4
        - switch.waveshare_8ch_relay_irrigation_relay_5
  actions:
    - delay:
        milliseconds: 250
    - if:
        - condition: template
          value_template: >
            {{ is_state('switch.waveshare_8ch_relay_irrigation_relay_1', 'on')
               or is_state('switch.waveshare_8ch_relay_irrigation_relay_2', 'on')
               or is_state('switch.waveshare_8ch_relay_irrigation_relay_3', 'on')
               or is_state('switch.waveshare_8ch_relay_irrigation_relay_4', 'on')
               or is_state('switch.waveshare_8ch_relay_irrigation_relay_5', 'on') }}
      then:
        - action: switch.turn_on
          target:
            entity_id: switch.shellyplugsg3_e4b32314f994_switch_0
      else:
        - action: switch.turn_off
          target:
            entity_id: switch.shellyplugsg3_e4b32314f994_switch_0
The short delay gives the relays a moment to settle, and mode: restart makes sure only the latest state change counts.
Soil sensors and the history chart
Below the zones are two cards for the WH52 soil sensors in the side and front borders. Each shows soil moisture, soil temperature and soil conductivity. Every row is clickable and opens the standard Home Assistant more-info dialog for that sensor, which I trigger from the button-card HTML by dispatching a hass-more-info event.
Next to them sits a Soil History chart built with apexcharts-card. Two buttons select the sensor and seven buttons the range, from 1 hour up to 1 month. The data doesn’t come from the Home Assistant recorder but from a small PHP endpoint on my local web server, which returns the stored readings as JSON. A REST sensor pulls it in and exposes the readings as attributes:
rest:
  - resource_template: >-
      {% set range_map = {'1H': '1h', '2H': '2h', '6H': '6h', '12H': '12h', '1D': '1d', '7D': '7d', '1M': '1m'} %}
      http://<local-server>/scripts/soil-history.php?sensor={{ states('input_select.irrigation_soil_history_chart_sensor') }}&range={{ range_map.get(states('input_select.irrigation_soil_history_chart_daterange'), '1d') }}
    method: GET
    scan_interval: 86400
    timeout: 10
    sensor:
      - name: Irrigation Soil History
        unique_id: irrigation_soil_history
        value_template: "{{ value_json.count | int(0) }}"
        json_attributes:
          - sensor_id
          - range
          - start
          - end
          - data
The scan interval is deliberately set to once a day. Instead of polling, a small automation calls homeassistant.update_entity as soon as I pick another sensor or range, so the chart only fetches data when I actually ask for it. In the chart, a data_generator maps the rows to moisture, temperature and conductivity series, each with its own y-axis.
A standard statistics graph at the bottom shows the conductivity of both sensors over the last four days. It’s a nice illustration of how different two borders in the same garden can be: one sits around 130 to 140 µS/cm, the other around 35 µS/cm.
Schedule overview and recent activity
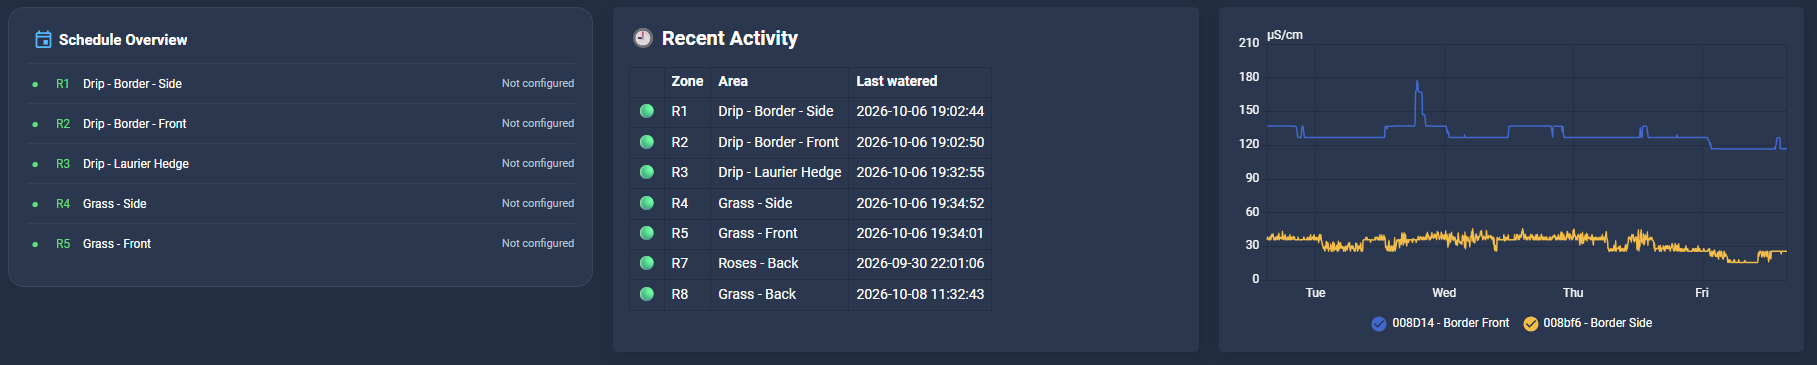 The last row gives a quick overview. The Schedule Overview reads an
 input_text per zone and currently shows “Not configured” everywhere, because automated scheduling is the next phase. The Recent Activity card is a simple markdown card with a Jinja table listing the last-watered timestamp of every zone, so I can see in one look which zones have been skipped for too long.
Making it work on every screen
The dashboard is mostly used on a phone in the garden, so it has to work on small screens too. Every row is a layout-card grid with media queries: the five status tiles become a 3-column grid on tablets and a 2-column grid on phones, and the zone cards shrink from five columns to three, two or one depending on the screen width. A separate query for touch devices (pointer: coarse) makes sure tablets in landscape also get the compact layout.
What’s next
The dashboard and manual control are done, but the system isn’t finished yet. Next on my list:
- Scheduling, ideally weather-based, so zones get skipped after rain.
- Flow-based leak detection: if water flows while no valve is open, or a zone uses far more water than usual, I want to know.
- Moisture-based decisions for the borders using the soil sensors.
- Refactoring the zone cards into a button-card template. Each card is now several hundred lines of YAML, and most of it is identical across zones.
- Expanding the Settings pop-up (a bubble-card pop-up) that now holds the spare relays 6 to 8 and the controller’s RGB LED.
The irrigation entity package and the dashboard view yaml is available as downloads at the bottom of this blog post.