My WordPress site runs WP Statistics for privacy-friendly analytics, and its “Traffic Summary” widget on the dashboard is genuinely useful — online visitors, today/yesterday/7-day/28-day/all-time totals, with trend percentages. I wanted that exact same information sitting on my Home Assistant dashboard, next to everything else I already monitor.
Why not just use the official REST API add-on?
WP Statistics ships a paid “REST API” add-on that exposes this kind of data externally. I didn’t want another subscription for something this small, and I already have full PHP execution on the site through my Novamira MCP integration — so instead of paying for an add-on, I went straight at the plugin’s own internals.
Reverse-engineering the widget
Using novamira/execute-php, I could run arbitrary PHP directly inside the live WordPress environment — full access to $wpdb, every loaded class, everything. First step was finding out which legacy template functions WP Statistics still exposes:
wp_statistics_visitor(time, daily=null, count_only=false, options=[])
wp_statistics_visit(time, daily=null)
wp_statistics_useronline(options=[])
Those are the old-style helper functions, but the actual “Traffic Summary” metabox you see on the WP Statistics dashboard is built by a newer class-based data provider. Searching the plugin source for the string “Traffic Summary” led straight to it: src/Service/Admin/Metabox/Metaboxes/TrafficSummary.php, which calls MetaboxDataProvider::getTrafficSummaryData(). That method boils down to two calls:
$data = [
    'online'  => $this->onlineModel->countOnlines($args),
    'summary' => ChartDataProviderFactory::summaryChart(['include_total' => true])->getData()
];
Running that directly returned the exact same structure the widget renders — today, yesterday, 7 days, 28 days, and an all-time total, each with visitor and view counts, and (for the comparison periods) the direction and percentage change versus the previous period. Since this is the plugin’s own code path, the numbers are guaranteed to always match what you see in wp-admin, with zero risk of drifting out of sync from some parallel SQL query I’d have had to maintain myself.
Building the REST endpoint
With the right internal calls identified, I wrapped them in a small custom REST route: GET /wp-json/rutger/v1/traffic-summary. It flattens the nested widget data into something easy for a Home Assistant REST sensor to consume, and it’s protected by a shared-secret API key passed as an X-Api-Key header — nothing fancy, but enough that the endpoint isn’t just sitting open on a public site.
<?php
/**
 * Custom REST API endpoint exposing the WP Statistics "Traffic Summary" widget data
 * for consumption by Home Assistant.
 *
 * Endpoint: GET /wp-json/rutger/v1/traffic-summary
 * Auth:     header  X-Api-Key: <token>
 */
if (!defined('ABSPATH')) exit;

define('RUTGER_TRAFFIC_SUMMARY_API_KEY', 'YOUR-SECRET-TOKEN-HERE');

add_action('rest_api_init', function () {
    register_rest_route('rutger/v1', '/traffic-summary', [
        'methods'             => 'GET',
        'callback'            => 'rutger_traffic_summary_callback',
        'permission_callback' => 'rutger_traffic_summary_permission',
    ]);
});

function rutger_traffic_summary_permission(WP_REST_Request $request)
{
    $provided = $request->get_header('x-api-key');

    if (!$provided || !hash_equals(RUTGER_TRAFFIC_SUMMARY_API_KEY, $provided)) {
        return new WP_Error('rest_forbidden', 'Invalid or missing API key', ['status' => 401]);
    }

    return true;
}

function rutger_traffic_summary_callback(WP_REST_Request $request)
{
    if (!class_exists('WP_StatisticsModelsOnlineModel') || !class_exists('WP_StatisticsServiceChartsChartDataProviderFactory')) {
        return new WP_Error('wp_statistics_missing', 'WP Statistics plugin is not active', ['status' => 500]);
    }

    $onlineModel = new WP_StatisticsModelsOnlineModel();

    $summary = WP_StatisticsServiceChartsChartDataProviderFactory::summaryChart(['include_total' => true])->getData();

    $flatten = function ($period) {
        $out = [
            'visitors' => $period['data']['current']['visitors'] ?? 0,
            'views'    => $period['data']['current']['views'] ?? 0,
        ];
        if (!empty($period['comparison']) && isset($period['data']['trend'])) {
            $out['visitors_change_pct'] = $period['data']['trend']['visitors']['percentage'] ?? null;
            $out['visitors_direction']  = $period['data']['trend']['visitors']['direction'] ?? null;
            $out['views_change_pct']    = $period['data']['trend']['views']['percentage'] ?? null;
            $out['views_direction']     = $period['data']['trend']['views']['direction'] ?? null;
        }
        return $out;
    };

    $response = [
        'online'       => $onlineModel->countOnlines([]),
        'today'        => $flatten($summary['today']),
        'yesterday'    => $flatten($summary['yesterday']),
        'last_7_days'  => $flatten($summary['7days']),
        'last_28_days' => $flatten($summary['28days']),
        'total'        => $flatten($summary['total']),
        'generated_at' => current_time('mysql'),
    ];

    return rest_ensure_response($response);
}
A request without the header gets a clean 401; a request with the correct key gets back something like:
{
  "online": 0,
  "today": { "visitors": 43, "views": 60 },
  "yesterday": {
    "visitors": 36, "views": 94,
    "visitors_change_pct": 2.7, "visitors_direction": "down",
    "views_change_pct": 18.3, "views_direction": "down"
  },
  "last_7_days": {
    "visitors": 190, "views": 563,
    "visitors_change_pct": 42.8, "visitors_direction": "down",
    "views_change_pct": 31, "views_direction": "down"
  },
  "last_28_days": {
    "visitors": 909, "views": 2192,
    "visitors_change_pct": 16.4, "visitors_direction": "up",
    "views_change_pct": 47.3, "views_direction": "up"
  },
  "total": { "visitors": 999999, "views": 99999},
  "generated_at": "2026-07-17 23:14:34"
}
Where the file actually lives
My first instinct was to drop this into Novamira’s sandbox directory (wp-content/novamira-sandbox/), which is convenient for quick iteration since Novamira auto-loads everything in there on every request. But a sandbox is meant for exactly that — fast iteration and crash recovery of AI-generated code — not a permanent, always-on integration endpoint. Once I confirmed it worked, I moved the exact same file into wp-content/mu-plugins/ instead.
Must-use plugins load automatically on every request, can’t be accidentally deactivated from the Plugins screen, and don’t depend on Novamira’s sandbox loader staying active. For a small integration endpoint like this that Home Assistant is going to poll indefinitely, that’s a much better home than a directory literally named “sandbox”.
The Home Assistant side: REST sensor
On the Home Assistant side, a single rest: platform block defines six sensors from one HTTP call — the top-level state for each, plus the secondary numbers (views, trend direction, trend percentage) tucked away as attributes rather than separate entities, to avoid cluttering the entity list.
rest:
  - resource: https://rutg3r.com/wp-json/rutger/v1/traffic-summary
    scan_interval: 900  # 15 min; site is fairly low-traffic, no need to poll harder
    headers:
      X-Api-Key: !secret rutg3r_traffic_api_key
    sensor:
      - name: "Rutg3r Online Visitors"
        value_template: "{{ value_json.online }}"
      - name: "Rutg3r Visitors Today"
        value_template: "{{ value_json.today.visitors }}"
        json_attributes_path: "$.today"
        json_attributes:
          - views
      - name: "Rutg3r Visitors Yesterday"
        value_template: "{{ value_json.yesterday.visitors }}"
        json_attributes_path: "$.yesterday"
        json_attributes:
          - views
          - visitors_change_pct
          - visitors_direction
          - views_change_pct
          - views_direction
      - name: "Rutg3r Visitors 7d"
        value_template: "{{ value_json.last_7_days.visitors }}"
        json_attributes_path: "$.last_7_days"
        json_attributes:
          - views
          - visitors_change_pct
          - visitors_direction
          - views_change_pct
          - views_direction
      - name: "Rutg3r Visitors 28d"
        value_template: "{{ value_json.last_28_days.visitors }}"
        json_attributes_path: "$.last_28_days"
        json_attributes:
          - views
          - visitors_change_pct
          - visitors_direction
          - views_change_pct
          - views_direction
      - name: "Rutg3r Visitors Total"
        value_template: "{{ value_json.total.visitors }}"
        json_attributes_path: "$.total"
        json_attributes:
          - views
The API key itself goes into secrets.yaml, never directly into configuration.yaml:
rutg3r_traffic_api_key: your-generated-token-here
A 15-minute scan_interval is plenty — this isn’t data that needs second-by-second freshness, and there’s no point hammering the endpoint (or the underlying WP Statistics queries) more often than that.
The dashboard card
For the visual side I initially reached for a Markdown card with a plain markdown table, which works but folds badly once you throw multi-line Jinja templates at it. Switching to a literal YAML block scalar (| instead of >) with a raw HTML <table> fixed the row-folding problem completely.
The one thing that didn’t work as expected: colored up/down indicators using inline style attributes on <span> elements. As of Home Assistant’s 2025.12 release, the markdown card’s HTML sanitizer strips style and class attributes entirely — a security tightening that also means CSS-based coloring inside a markdown card is no longer possible at all, full stop. No template trick gets around it, because the attribute itself never reaches the DOM.
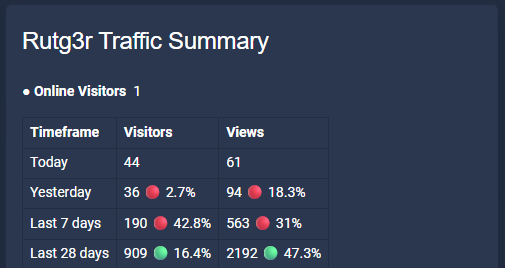
The workaround: colored circle emoji (🟢 / 🔴) instead of CSS colors. Emoji glyphs carry their own color regardless of what the sanitizer strips, so a green or red dot next to each trend percentage gets the same at-a-glance signal as colored text would, without needing any styling at all. Here’s the final card, exactly as it’s running on my dashboard today:
type: markdown
title: Traffic Summary
content: |
<p><b>● Online Visitors</b> {{ states('sensor.rutg3r_online_visitors') }}</p>
<table style="width:100%; border-collapse: collapse;">
<tr>
<th style="text-align:left; padding:4px 0;">Timeframe</th>
<th style="text-align:right; padding:4px 0;">Visitors</th>
<th style="text-align:right; padding:4px 0;">Views</th>
</tr>
<tr>
<td style="padding:4px 0;">Today</td>
<td style="text-align:right;">{{ states('sensor.rutg3r_visitors_today') }}</td>
<td style="text-align:right;">{{ state_attr('sensor.rutg3r_visitors_today','views') }}</td>
</tr>
<tr>
<td style="padding:4px 0;">Yesterday</td>
<td style="text-align:right;">{{ states('sensor.rutg3r_visitors_yesterday') }} {{ 'U0001F7E2' if state_attr('sensor.rutg3r_visitors_yesterday','visitors_direction') == 'up' else 'U0001F534' }} {{ state_attr('sensor.rutg3r_visitors_yesterday','visitors_change_pct') }}%</td>
<td style="text-align:right;">{{ state_attr('sensor.rutg3r_visitors_yesterday','views') }} {{ 'U0001F7E2' if state_attr('sensor.rutg3r_visitors_yesterday','views_direction') == 'up' else 'U0001F534' }} {{ state_attr('sensor.rutg3r_visitors_yesterday','views_change_pct') }}%</td>
</tr>
<tr>
<td style="padding:4px 0;">Last 7 days</td>
<td style="text-align:right;">{{ states('sensor.rutg3r_visitors_7d') }} {{ 'U0001F7E2' if state_attr('sensor.rutg3r_visitors_7d','visitors_direction') == 'up' else 'U0001F534' }} {{ state_attr('sensor.rutg3r_visitors_7d','visitors_change_pct') }}%</td>
<td style="text-align:right;">{{ state_attr('sensor.rutg3r_visitors_7d','views') }} {{ 'U0001F7E2' if state_attr('sensor.rutg3r_visitors_7d','views_direction') == 'up' else 'U0001F534' }} {{ state_attr('sensor.rutg3r_visitors_7d','views_change_pct') }}%</td>
</tr>
<tr>
<td style="padding:4px 0;">Last 28 days</td>
<td style="text-align:right;">{{ states('sensor.rutg3r_visitors_28d') }} {{ 'U0001F7E2' if state_attr('sensor.rutg3r_visitors_28d','visitors_direction') == 'up' else 'U0001F534' }} {{ state_attr('sensor.rutg3r_visitors_28d','visitors_change_pct') }}%</td>
<td style="text-align:right;">{{ state_attr('sensor.rutg3r_visitors_28d','views') }} {{ 'U0001F7E2' if state_attr('sensor.rutg3r_visitors_28d','views_direction') == 'up' else 'U0001F534' }} {{ state_attr('sensor.rutg3r_visitors_28d','views_change_pct') }}%</td>
</tr>
<tr>
<td style="padding:4px 0;"><b>Total</b></td>
<td style="text-align:right;"><b>{{ states('sensor.rutg3r_visitors_total') }}</b></td>
<td style="text-align:right;"><b>{{ state_attr('sensor.rutg3r_visitors_total','views') }}</b></td>
</tr>
</table>
If you want real CSS-driven coloring instead of emoji, the only paths left after 2025.12 are a HACS card that doesn’t sanitize styles — card-mod layered on top of the markdown card, or Piotr Machowski’s HTML Jinja2 Template card, which renders raw HTML without going through the markdown sanitizer at all.
The result
The end result sits on my dashboard exactly like the original WP Statistics widget — online visitor count up top, then a clean table with today, yesterday, last 7 days, last 28 days, and the all-time total, visitors and views side by side, with green or red indicators on anything that has a comparable trend period.
Why go this route instead of the paid add-on
Three reasons, in order of how much they mattered to me: it costs nothing beyond the infrastructure I already run; the data is guaranteed to match the wp-admin widget exactly, since it literally calls the same internal methods rather than reimplementing the logic; and it forced me to actually understand how WP Statistics structures its data internally, which is knowledge I’ll reuse the next time I want to pull something else out of it.